









Dollar Yield: Considerations to Get Maximum Return From Cash
Why the dollars in a portfolio deserve a rate. And why a higher one compounds into real money.

This article is educational. It explains how compounding works on cash over time.
Most portfolios hold cash, and most of that cash is underpaid. As of mid-2026, the national-average savings account pays about 0.4% (FDIC). Meanwhile the same dollars, in a money-market fund, high-yield account, or Treasury bill, can earn roughly 4.5% (Crane 100 Money Fund Index, Treasury.gov). That is not a rounding error. It is a decision most people never actively make.
The dollars in your portfolio are not idle. They are earning something. The only real question is how much they are leaving on the table. And over a multi-year horizon, that answer compounds into a surprisingly large number.
This piece makes two claims, both with the math attached. First: on cash, the rate does almost all of the work, and small differences in rate become large differences in dollars. Second: once cash earns a real rate, it stops being dead weight in a portfolio and starts behaving like a low-volatility return contributor. Both claims argue for the same thing — that dollars belong in a portfolio with a rate, not without one.
Part 1 - On cash, the rate is the whole story
Cash does not appreciate. A dollar is a dollar. So unlike a stock, the entire return on a cash position is the rate it earns. That makes cash the cleanest possible demonstration of compounding: there is no price movement to obscure it.
Take $100,000 and hold it for ten years at four different rates.
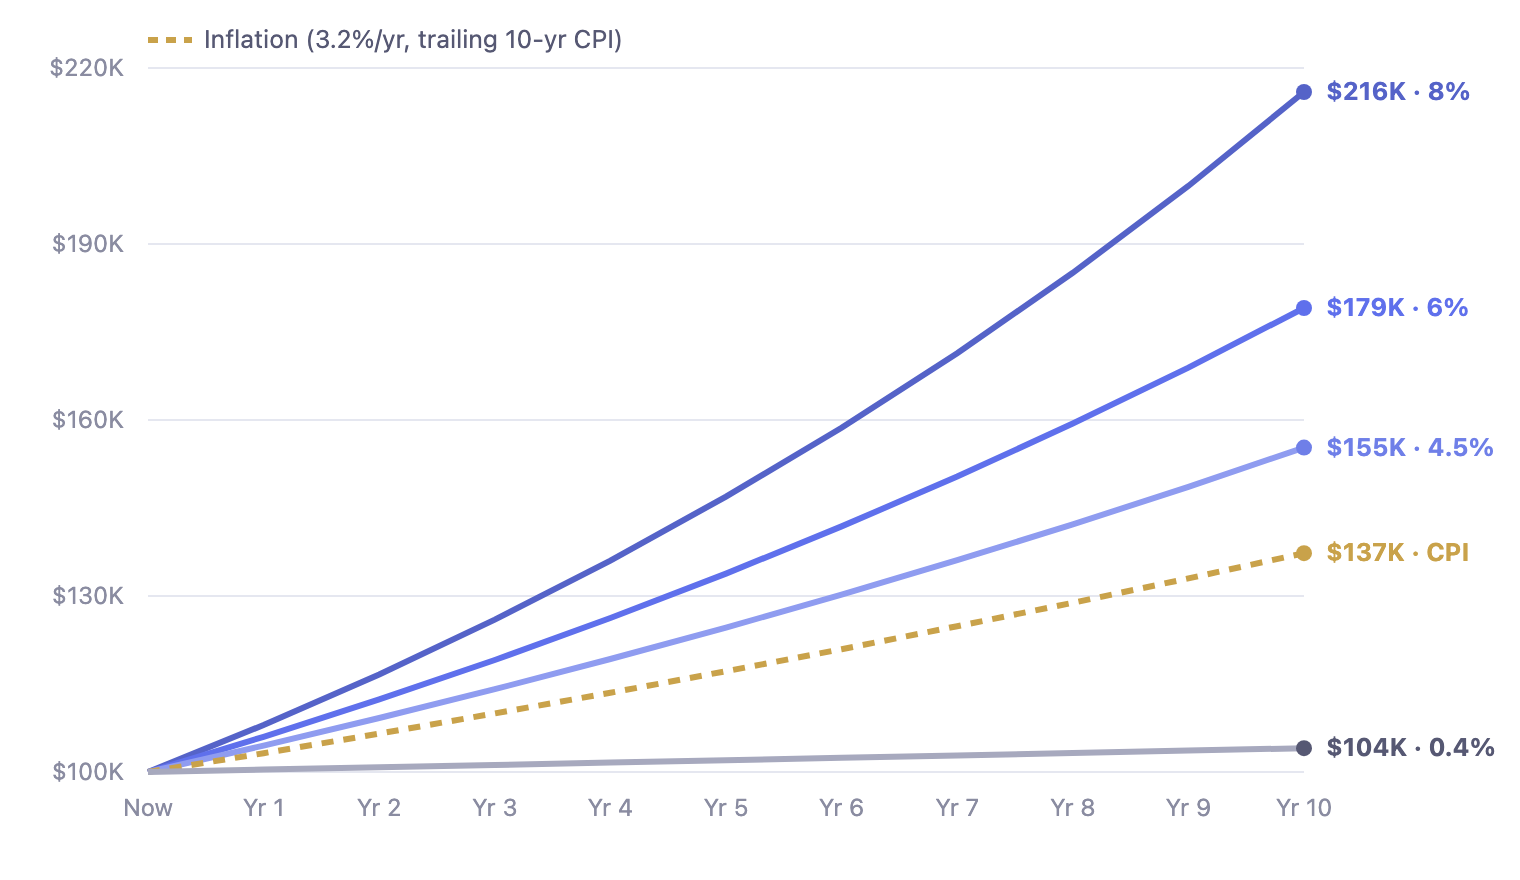
Hypothetical illustration with hypothetical yields, shown for illustration only.
The bottom line is where most cash actually sits. At 0.4%, ten years turns $100,000 into about $104,000 — the dollars barely move. At 4.5%, the rate available in a money-market fund or high-yield account today, the same $100,000 becomes about $155,000. Simply moving idle cash off the national average is worth roughly $51,000 over the decade. No new risk asset, no market call — just a rate.
Above that sit the higher-yield paths. At 6%, the ending value is about $179,000; at 8%, about $216,000. The gap between leaving cash at 0.4% and earning 6% is about $75,000 over ten years. That’s three-quarters of the original principal, produced by the rate alone.
Lengthen the horizon and the fan widens faster than intuition expects. Over twenty years, the same 6%-versus-0.4% gap grows to about $212,000, more than twice the starting principal. Compounding rewards time non-linearly, which is why the cost of an underpaid dollar keeps accelerating the longer it stays underpaid.
Why each additional point of yield is worth more than the last
It is tempting to treat yield as additive, as if going from 4% to 5% adds the same value as going from 7% to 8%. It does not. Each additional point compounds on a larger base, so its dollar value grows.
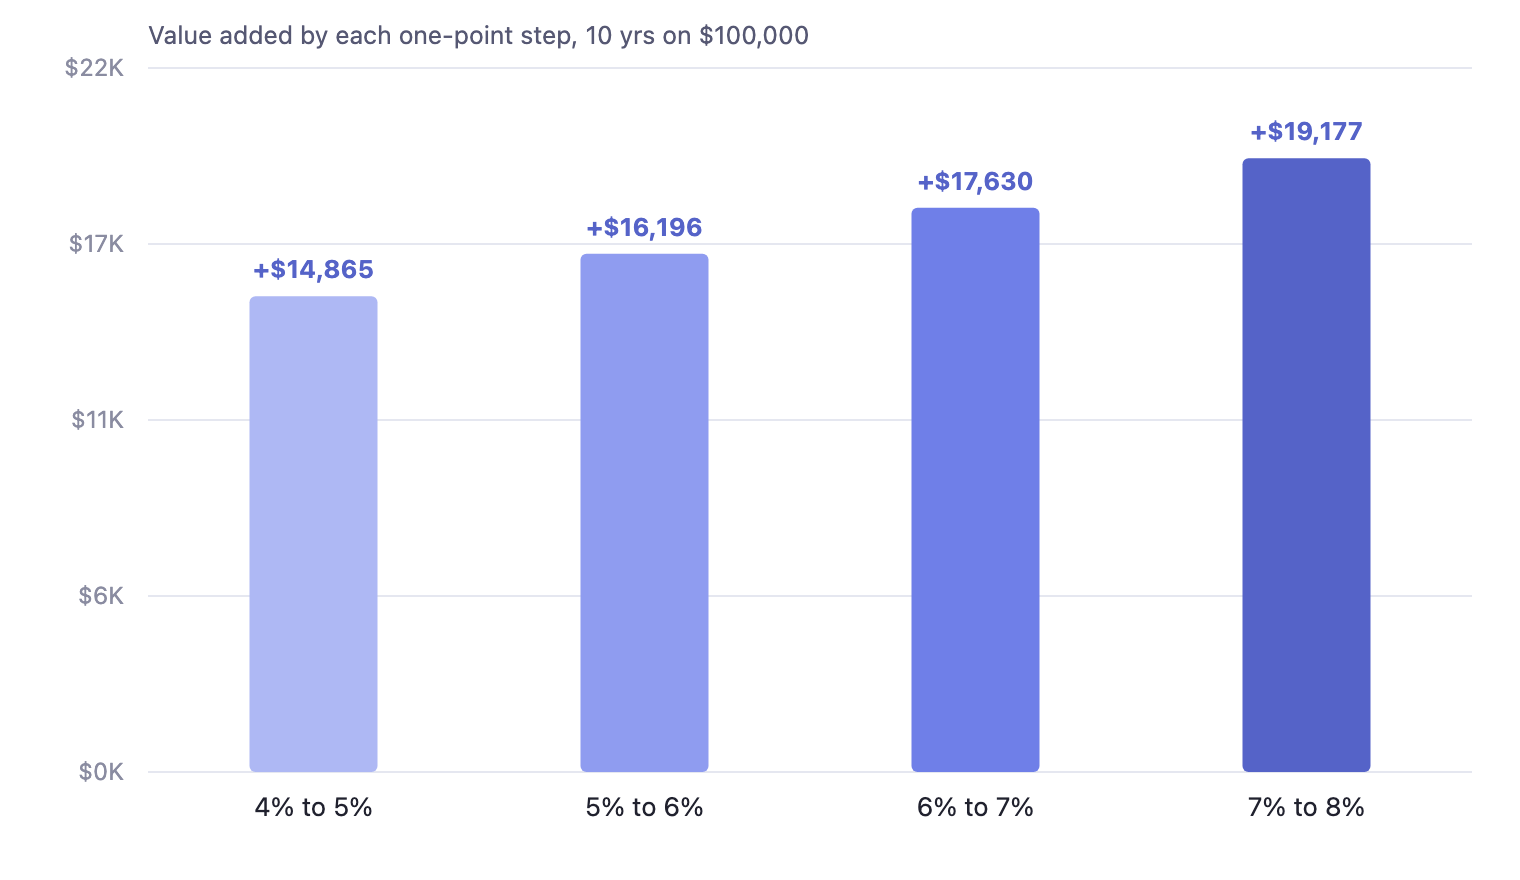
Hypothetical illustration with hypothetical yields, shown for illustration only.
Over ten years on $100,000, moving from 4% to 5% adds about $14,900. From 5% to 6% adds $16,200. From 6% to 7%, $17,600. From 7% to 8%, $19,200. Same one-point step each time; a bigger reward each time.
The practical conclusion: the yield you negotiate, select, or forgo at the top of the range matters more per point than the yield at the bottom. Chasing the first few points off a savings account is the easy win. Capturing the points above a money-market rate is where the marginal dollars are largest. Of course, all of that is pending risk considerations, which we discuss below.
Part 2 - Cash as a return contributor, not dead weight
Portfolios often treat cash as ballast: dry powder, a liquidity buffer, the part that is supposed to do nothing. At a savings rate, that assumption is self-fulfilling, as the the cash is essentially doing nothing.
Give the same cash a real rate and the assumption can be questioned. The dollars still provide liquidity and still dampen volatility, but now they also carry a share of the portfolio's return. The question becomes: for a given allocation to dollars, how much does each additional point of yield actually add to the whole portfolio?
Here is that answer for a $1,000,000 portfolio, measured as the ten-year value each combination adds versus leaving the cash at 0.4%.
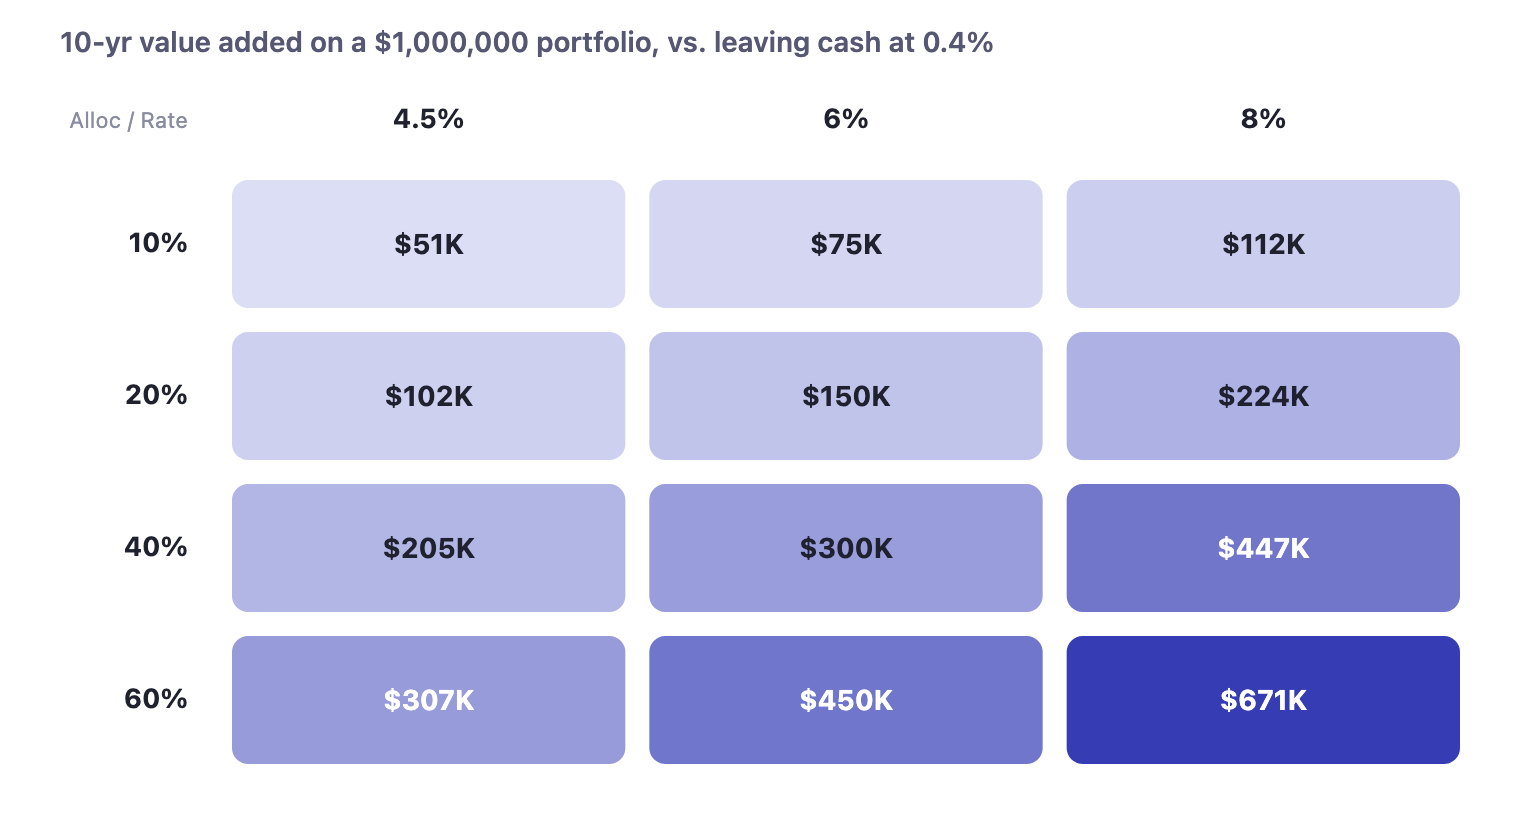
Hypothetical portfolio with hypothetical yields, shown for illustration only.
Read it in two directions. Down any column, a larger dollar allocation scales the benefit linearly. The effect is real at 10% and simply larger at 60%. Across any row, each step up in rate adds materially, and the steps grow, for the compounding reason above.
The corners tell the story. A 10% cash allocation moved from a savings account to a 4.5% money-market rate adds about $51,000 over ten years. Quiet, but risk isn’t materially added historically speaking. A 40% allocation earning 6% adds about $300,000. A 60% allocation earning 8% adds about $671,000 to a $1,000,000 portfolio over the decade — from the part of the book that was supposed to do nothing.
That is the case for dollars in a portfolio. Not as an absence of risk assets, but as a deliberate, income-producing allocation whose contribution you can size and plan around. That’s something the volatile allocations, for all their upside, can never promise in advance.
The honest part: a higher rate is not a free lunch
Everything above is arithmetic, and arithmetic does not distinguish between a safe rate and a risky one. The reader must.
A money-market fund, a Treasury bill, and an FDIC-insured savings account carry very different risk from a higher-yielding USD strategy. Conventional cash options up to roughly 4.5% are government-backed or federally insured to applicable limits. Yields above that range are compensation for taking on something the insured options do not: counterparty exposure, smart-contract or protocol risk, credit and liquidity risk, and terms that may include lock-ups or redemption conditions.
So the correct way to read the exhibits is not "more yield is always better." It is: the opportunity cost of an underpaid dollar is large and compounding, and it is worth understanding what a higher rate would require of you. This might include the risks, the terms and the counterparty. All worthy considerations before deciding how much of that opportunity cost to capture. The dollars deserve a rate. Which rate is a risk decision, made with eyes open.
Considerations
Holding USD is common across individuals, corporations and institutions. It might be for easily accessible liquidity. Or for a rainy day. Perhaps while you wait for the right investment or price. Or it’s just part of the investment strategy. But there is always a lot of cash waiting on the sidelines. Making the most of this is a worthy consideration.
Where Abra fits
Abra Capital Management, LP ("ACM") is an SEC-registered investment adviser. Its US Dollar Yield strategy (USDaf) is designed to put the dollars in a portfolio to work at a yield above conventional cash rates, held under qualified custody in client-titled accounts, with net-of-fee reporting and defined, disclosed terms. The illustrative rates in this piece were chosen conservatively; USDaf's actual rate, terms, and risks — the details that matter for the risk decision above — are published and kept current. USDaf is not suitable for all investors.
If a single extra point of yield compounds into five figures on a modest cash allocation, and a real allocation into six, then the rate your dollars earn is not a detail. It is a portfolio decision worth making deliberately.
Abra yield strategies
Each strategy targets yield above conventional rates, held under qualified custody in client-titled accounts, with net-of-fee reporting. Rates vary by strategy and are published per product.
US Dollar Yield (USDaf): yield on dollars and stablecoins. See rate, terms & risks
Methodology
Each scenario compounds a single lump sum annually with no withdrawals: ending value = principal × (1 + rate) ^ years. Part 1 uses $100,000; Part 2 uses a $1,000,000 portfolio at the stated USD allocation and measures value incremental to a 0.4% baseline. Benchmark cash rates (mid-2026): national-average savings ~0.38–0.41%, and high-yield savings / money-market / T-bills ~4.15–5.00% are drawn from FDIC National Rates, Bankrate, and Forbes Advisor. Illustrative strategy rates (6%, 8%) are assumed inputs, not product rates. All figures are gross of fees and taxes.
Published August 5, 2026.
Past performance is not indicative of future results or forward potential. Hypothetical and projected performance has inherent limitations, does not reflect actual client results, and is not a guarantee of future outcomes. Portfolio examples are illustrative and not suitable for all investors. Figures are gross of fees and taxes; managed accounts are net of any applicable fees.
Stay ahead of on-chain markets
Get Abra Digital Asset Insights in your inbox — or talk to our team about your portfolio.