








Compounding Wealth Scenario: Maximize Yield
Modeling a multi-year crypto portfolio, with a twist: yield on top.
This article is educational. It explains how compounding works over time using various yield-generating assets for illustration.
Two investors build the same portfolio on the same day. In January 2020 each puts $100,000 to work in the same allocation: 30% Bitcoin, 30% Ethereum, and 40% cash. They hold through the same six years: the 2021 run, the 2022 drawdown, the 2024–2025 recovery. They touch nothing.
One difference separates them. The first lets the assets sit. Her cash earns 1% in a savings account, and her Bitcoin and Ethereum simply track price. The second lets every position earn yield, and lets that yield compound.
Six years later the gap between them is about $191,000 on a starting stake of $100,000, in a portfolio neither investor actively managed.
That gap is the subject of this piece. Not the headline crypto returns, which were extraordinary and are not the point. The point is the quieter mechanism sitting underneath them.
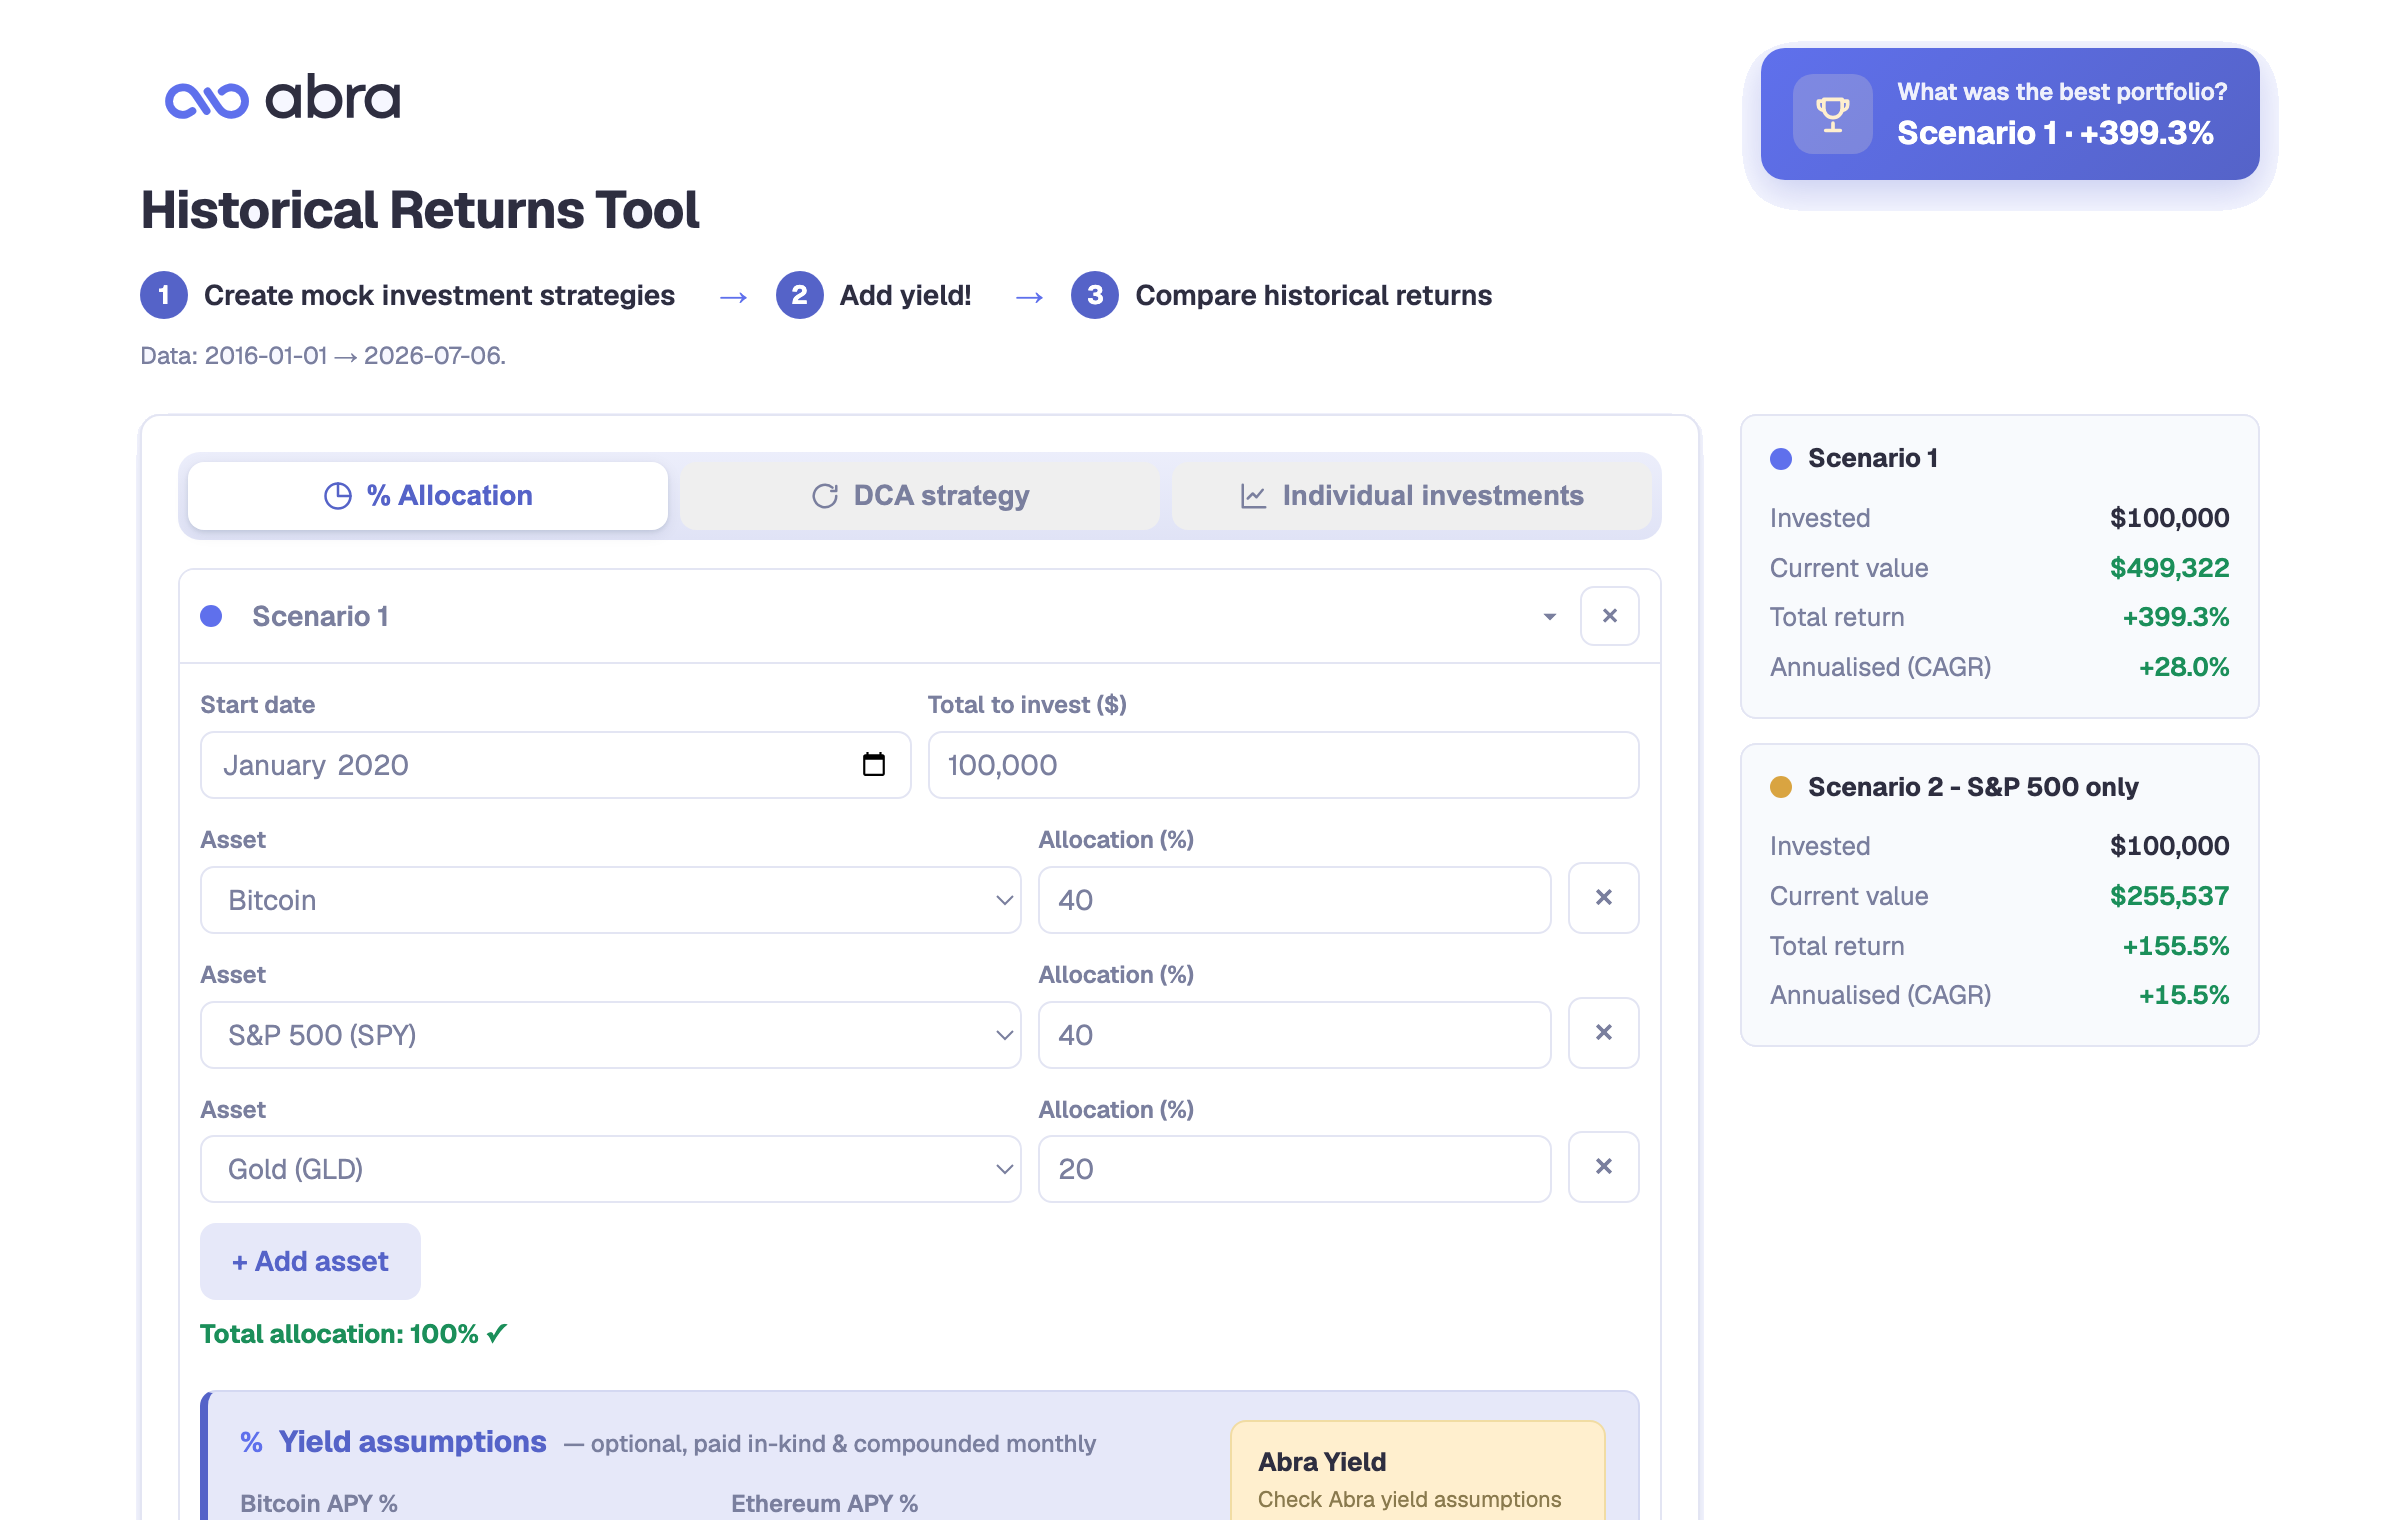
This analysis was built in the Abra Portfolio Builder (abra.com). You can rebuild it in a few minutes: set a $100,000 starting value, an allocation of 30% BTC / 30% ETH / 40% cash, and a January 2020 start date.
Mechanism before metric: what "yield compounding" actually does
Yield does not arrive as a separate line of cash you spend. In this model it is paid in kind, where you receive more of the same asset. Each period, the Bitcoin allocation earns a little more Bitcoin, the Ethereum allocation a little more Ethereum, the cash allocation a little more cash.
The compounding follows from one fact: next period's yield is calculated on a base that already includes last period's yield. A 2% yield on Bitcoin does not add 2% six times over six years. It adds 2% to a base that keeps growing, which works out to roughly 12.6% more Bitcoin by year six.
On the cash allocation, that is the whole story. $40,000 at 5% compounds to about $53,600 over six years; the same $40,000 at 1% reaches only about $42,500. The difference (roughly $11,000) comes entirely from the rate, not from any market move.
On the crypto allocations, something else happens. The extra coins earned along the way are themselves exposed to price. When Bitcoin and Ethereum appreciate, that larger coin base rides the appreciation. So the dollar value of the yield is amplified by whatever the market does, up or down. This is the part worth sitting with, and we return to it below.
A boundary, stated plainly. In-kind crypto yield is not free. It depends on the strategy generating it, and it carries its own risks including counterparty, smart-contract, liquidity, and lock-up terms. Yield can be positive in a year when price is negative, and it does not offset a large drawdown. This model also assumes no rebalancing and is gross of fees and taxes.
The six-year result
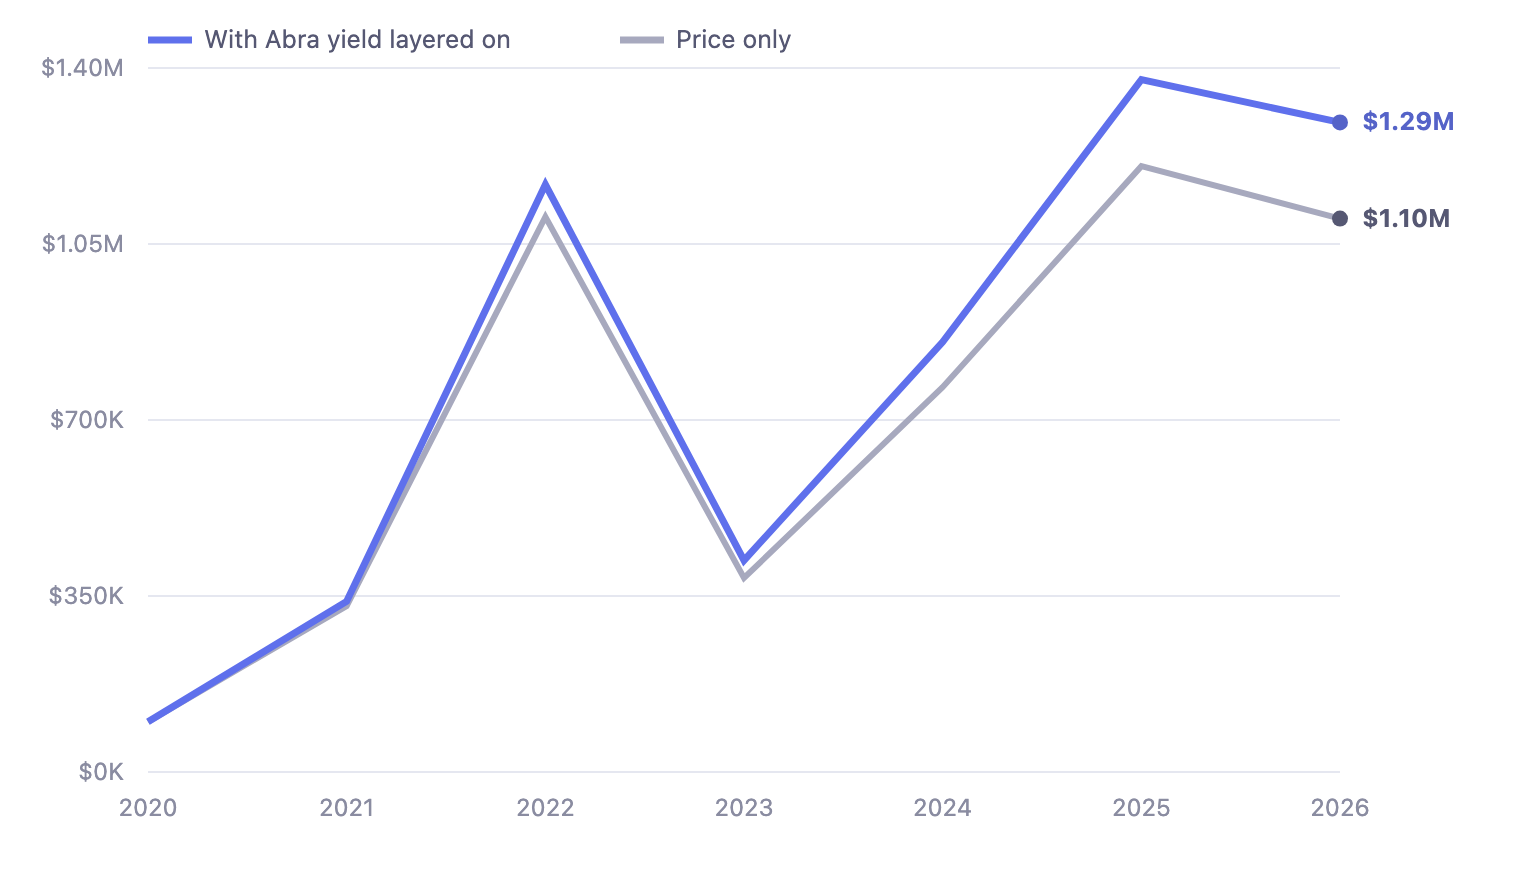
With those assumptions, here is how the two paths diverge from January 2020 to January 2026.
Hypothetical portfolio, shown for illustration only, with hypothetical yields.
The price-only portfolio ends near $1.10M. The same portfolio with yield layered on ends near $1.29M, which is about $191,000, or 17.4%, more. Note the shape: both lines take the full 2022–2023 drawdown. Yield did not prevent the fall. It compounded quietly on either side of it.
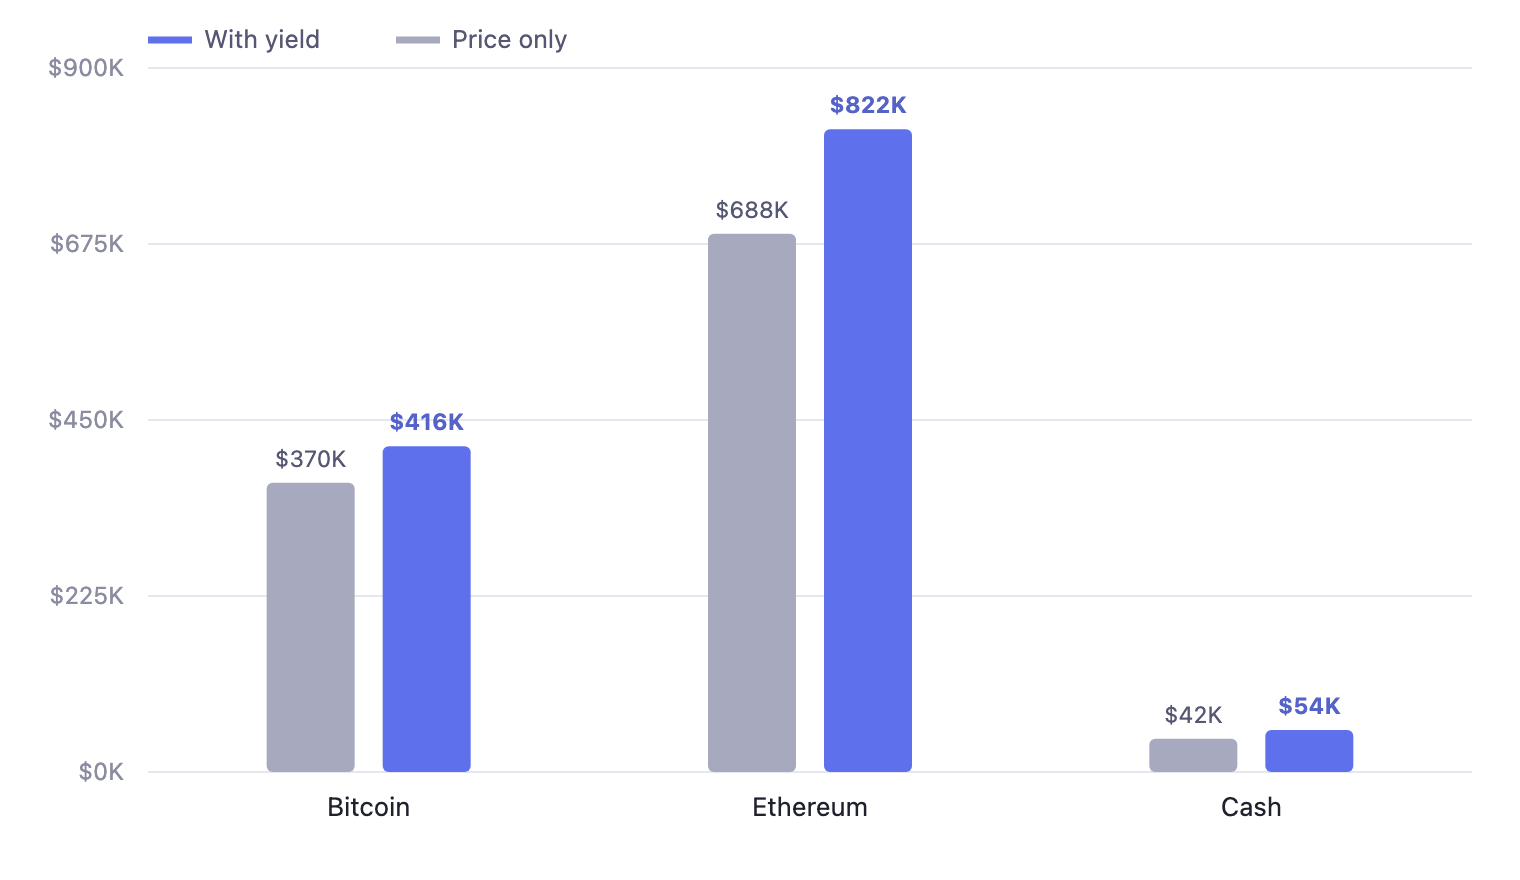
Breaking the $191,000 apart by allocation shows where it comes from and why the reframe in the next section matters.
Hypothetical portfolio, shown for illustration only, with hypothetical yields.
The Ethereum allocation contributes most of the uplift (about $134,000), the Bitcoin allocation about $47,000, and cash about $11,000. That ordering is not because the yield rate on Ethereum was highest. It was set at 3%. It is because Ethereum appreciated the most, so its larger coin base was worth the most in dollar terms.
The part you can actually design for
Here is the honest reading of that chart, and the reason this is a compounding story rather than a crypto story.
The loud part of the picture, Bitcoin rising roughly 12x and Ethereum roughly 23x over these six years, is the part no one can design for. It was not knowable in January 2020, it is specific to this window, and it will not repeat on schedule. If the article were really about those multiples, it would be a story about luck and timing.
The quiet part, the ~17% uplift from yield, behaves differently. It is a function of two things you control: the rate you earn and the time you stay invested. It does not require calling the market. On this portfolio it added ~17% whether the ending value was high or low, because it compounds the base regardless of direction.
That is the distinction worth long consideration. Price return is the variable you can only react to. Yield compounding is the variable you can plan around.
Does the effect depend on picking 2020?
A single favorable start date proves little. So we ran the same 30/30/40 portfolio for every January start from 2018 through 2025, each held to January 2026, and isolated the yield uplift on the ending value.
| Start (January) | Years held to Jan 2026 | Yield uplift on ending value |
|---|---|---|
| 2018 | 8 | +22.6% |
| 2019 | 7 | +19.2% |
| 2020 | 6 | +17.4% |
| 2021 | 5 | +14.9% |
| 2022 | 4 | +12.0% |
| 2023 | 3 | +7.9% |
| 2024 | 2 | +5.8% |
| 2025 | 1 | +3.1% |
Hypothetical portfolios with hypothetical yields, for illustration only.
The raw price outcomes across those start years ranged from spectacular to negative, depending entirely on entry point. The yield uplift did not swing with them. It rose in an orderly line with one variable only: how long the position was held. The longer the horizon, the larger the compounded uplift, which is the definition of compounding doing its work.
(We show the uplift percentage rather than ending dollar values, keeping the focus on the compounding effect rather than the entry price.)
Where yield earns its keep
The 2020 example makes yield look like a bonus on top of a strong market. The more useful case is the opposite one.
In a flat or falling year, price return gives you nothing or takes something away. Yield still compounds the base. It is the difference between standing still and moving forward, and between a full drawdown and a slightly cushioned one. Yield is not a hedge. It will not rescue a bad market, but it is the one contributor that keeps working when price does not.
For a multi-asset investor thinking in years rather than quarters, that reliability is the argument. Not that yield is large in any single period, but that it is dependable across all of them.
Modeling this with Abra
The Portfolio Builder at abra.com lets you run the exercise above with your own allocation, horizon, and yield assumptions. The rates used here (2% on Bitcoin, 3% on Ethereum, 5% on cash) were deliberately conservative inputs, chosen to keep the illustration credible rather than to flatter it.
Abra Capital Management, LP ("ACM") is an SEC-registered investment adviser. Its yield strategies — US Dollar Yield (USDaf), Bitcoin Yield (BTCaf), and Ethereum Yield (ETHaf) — are designed to target yield levels above the conservative rates modeled here, under qualified custody, with client-titled accounts and net-of-fee reporting. Actual rates vary and are subject to market conditions, strategy terms, and the risks disclosed for each product. These strategies are not suitable for all investors.
If a modest, dependable rate compounds to a $191,000 difference over six years, the case for understanding the actual rates (and the risks and terms attached to them) is straightforward.
Abra yield strategies
Each strategy targets yield above conventional rates, held under qualified custody in client-titled accounts, with net-of-fee reporting. Rates vary by strategy and are published per product.
- US Dollar Yield (USDaf) - yield on dollars and stablecoins. See rate, terms & risks
- Bitcoin Yield (BTCaf) - in-kind yield on bitcoin. See rate, terms & risks
- Ethereum Yield (ETHaf) - in-kind yield on ether. See rate, terms & risks
- Solana Staking (SOLaf) - staking yield on SOL. See rate, terms & risks
Methodology
Prices are January-1 values: Bitcoin from the CoinDesk / Yahoo Finance New Year's Day series; Ethereum from the Kraken New Year's Day open. The portfolio is $100,000 allocated 30% BTC / 30% ETH / 40% cash, bought once and held with no rebalancing. Yield is compounded annually and paid in kind: each year the position's unit count grows by its yield rate, and each allocation's value equals units × that year's price; cash grows at its stated rate. All figures are gross of fees and taxes; managed accounts are net of any applicable fees. Data should be verified against ACM's approved source before publication.
Published August 5, 2026.
Past performance is not indicative of future results or forward potential. Hypothetical and backtested performance has inherent limitations, does not reflect actual client results, and is not a guarantee of future outcomes. Portfolio examples are illustrative and not suitable for all investors. Figures are gross of fees and taxes; managed accounts are net of any applicable fees.
Stay ahead of on-chain markets
Get Abra Digital Asset Insights in your inbox — or talk to our team about your portfolio.